美國開放1950年人口統計資料庫供大家查詢、更正
1950 Census Records

Taken every 10 years since 1790, the United States census provides a snapshot of the nation's population. Because of a 72-year restriction on access to the records, the most recent census year currently available is 1950.
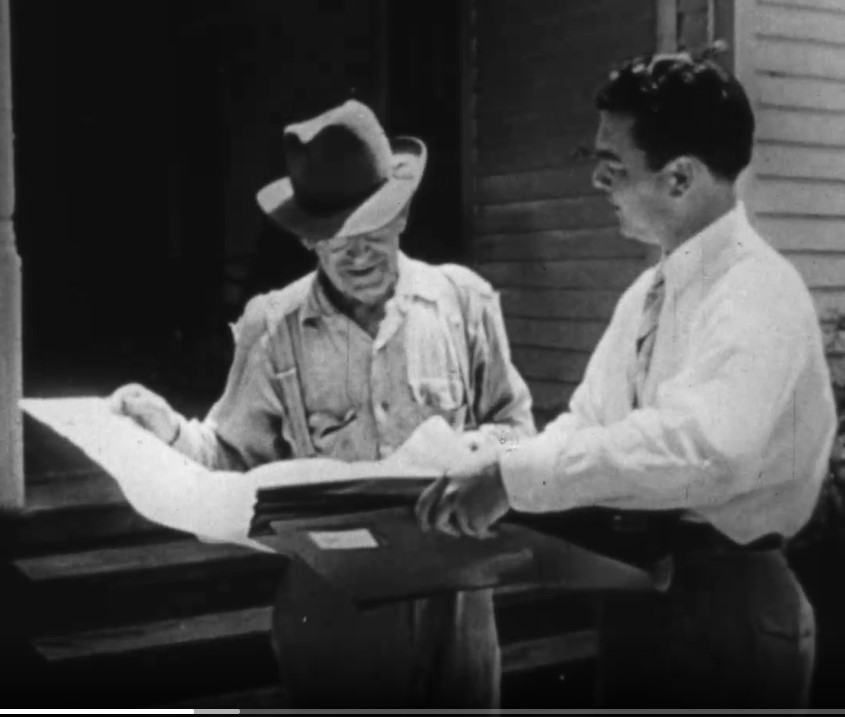
On April 1, 2022, the 1950 Census was released, and users can access it for free through a dedicated website at 1950census.archives.gov. This population census is the 17th decennial census of the United States. The National Archives and Records Administration (NARA) has digitized and is providing free online access to the 1950 Census population schedules for U.S. states and territories, enumeration district maps, and enumeration district descriptions.
Bulk Download: In addition, researchers can download the full 1950 Census dataset.

How You Can Help
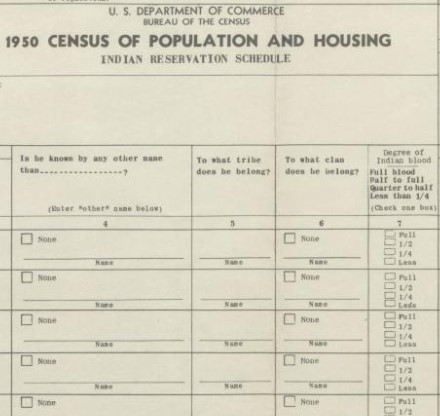
You can search the 1950 Census website by name and location. You can also search by Indian Reservation for form P8 Indian Reservation Schedules.
To develop the initial name index, we are using Amazon Web Services’ artificial intelligence / optical character recognition (AI/OCR) Textract tool to extract the handwritten names from the digitized 1950 Census population schedules.
Because the initial name index is built on optical character recognition (OCR) technology, it is not 100-percent accurate. The National Archives is asking for your help in submitting name updates to the index using a transcription tool that is available on the 1950 Census website. You can help us improve the accuracy of the name index and make the records more accessible for everyone. More information will be forthcoming.
Resources
Questions Asked on the 1950 Census
FAQs about the 1950 Census
Finding Aids
Instructions for Enumerators and the Public
Blank Census Forms
Information and Training Videos
Published Statistical Data
Native Americans in the Census
External Resources
1950 Census Blog Series on History Hub
****
Bleak Portrait of Poverty Is Off the Mark, Experts Say

John William Springs, a retiree who gets nearly $12,000 a year in Social Security and disability checks, is $1,300 above the poverty threshold: officially, not poor.
By JASON DePARLE, ROBERT GEBELOFF and SABRINA TAVERNISE
Published: November 3, 2011
WASHINGTON — When the Census Bureau said in September that the number of poor Americans had soared by 10 million to rates rarely seen in four decades, commentators called the report “shocking” and “bleak.” Most poverty experts would add another description: “flawed.”
Multimedia
Related
-
Study Finds Big Spike in Poorest in the U.S. (November 4, 2011)
Travis Dove for The New York Times
A new measure places Ashley Bolton above the poverty line.
Readers’ Comments
Share your thoughts.
Concocted on the fly a half-century ago, the official poverty measure ignores ever more of what is happening to the poor person’s wallet — good and bad. It overlooks hundreds of billions of dollars the needy receive in food stamps and other benefits and the similarly formidable amounts they lose to taxes and medical care. It even fails to note that rents are higher in places like Manhattan than they are in Mississippi.
On Monday, that may start to change when the Census Bureau releases a long-promised alternate measure meant to do a better job of counting the resources the needy have and the bills they have to pay. Similar measures, quietly published in the past, suggest among other things that safety-net programs have played a large and mostly overlooked role in restraining hardship: as much as half of the reported rise in poverty since 2006 disappears.
The fuller measures have also shown less poverty among children but more among older Americans, who are plagued by high medical costs. They have shown less poverty among blacks but more among Asians; less poverty in rural areas and more in cities and suburbs, where the cost of living is high. And they have found fewer people in abject destitution, but a great many more crowding the hard-luck ranks of the near poor, who do not qualify for many benefit programs and lose income to taxes, child care and medical costs.
“The official measure no longer corresponds to reality,” said Jane Waldfogel, a professor of social work at Columbia University. “It doesn’t get either side of the equation right — how much the poor have or how much they need. No one really trusts the data.”
Coming amid soaring need and bitter debt debates, the findings in Monday’s release are likely to offer fodder both to defenders of safety-net programs and fiscal conservatives who say the government already does much to temper hardship and needs to do no more.
Experts expect the new report to be consistent with a decade of research about the ways in which the official poverty rate distorts the realities of American poverty.
The numbers in this article are based on that research — by the census, the National Academy of Sciences and others — and include not just cash income but also government benefits, work expenses, taxes and cost of living. Many experts expect Monday’s census report, based on similar methods, to add a bit to the official poverty count of 46.2 million, while most experts also expect the recent growth will ap-pear less steep.
One alternate census data set quietly published last week said the number of poor people has grown by 4.6 million since 2006, not by 9.7 million as the bureau reported in September. At least 39 states showed no statistically significant poverty growth despite surging unemployment, according to an analysis by The New York Times, including Michigan, New York, New Jersey, Ohio, Tennessee and Texas.
In North Carolina, poverty has risen by more than 250,000 people by official count, but stayed flat under the alternate measure despite soaring unemployment.
One explanation can be found in programs the official count ignores: food stamps and tax credits. Combined the two programs delivered $221 billion across the country last year, according to the Center on Budget and Policy Priorities, more than doubling since 2006.
In Charlotte, Angelique Melton was among the beneficiaries. A divorced mother of two, Ms. Melton, 42, had worked her way up to a $39,000 a year position at a construction management firm. But as building halted in 2009, Ms. Melton lost her job.
Struggling to pay the rent and keep the family adequately fed, she took the only job she could find: a part-time position at Wal-Mart that paid less than half her former salary. With an annual income of about $7,500 — well below the poverty line of $17,400 for a family of three — Ms. Melton was officially poor.
Unofficially she was not.
After trying to stretch her shrunken income, Ms. Melton signed up for $3,600 a year in food stamps and received $1,800 in nutritional supplements from the Women, Infants and Children program. And her small salary qualified her for large tax credits, which arrive in the form of an annual check — in her case for about $4,000.
Along with housing aid, those subsidies gave her an annual income of nearly $18,800 — no one’s idea of rich, but by the new count not poor.
“They help you, my God,” Ms. Melton said. “I would not have made it otherwise.”
The official way of counting poverty — beloved not even by many of the people who run the count — is a historical artifact. A federal official named Mollie Orshansky created it as a placeholder in 1963 until something more sophisticated came along.
It takes a limited view of income by counting cash alone. It ignores expenses, like taxes and medical costs. And it set the poverty threshold in an outmoded way — as a multiple of food costs, which have dwindled as a share of most budgets, as is typical as a country becomes richer over time.
All three elements need updating, experts say. Yet other than to adjust the poverty line for inflation, the government has not changed it since Ms. Orshansky’s day. Efforts to do so have been slowed by both technical and political concerns. Conservatives worry liberals will inflate the number to justify more spending; liberals worry conservatives will define poverty away.
Virtually every effort to take a fuller view — counting more income and more expenses — shows poverty rising more slowly in the recession than the official data suggests. That is true of localized studies in New York City and Wisconsin and at least four different national data sets that the Census Bureau publishes. While the official national measure shows a rise of 9.8 million people, the fuller census measures show a range from 4.5 million to 4.8 million.
“That’s a big difference,” said Timothy Smeeding, an economist at the University of Wisconsin who oversaw the study in that state. “It’s about time we started counting the programs we use to fight poverty.”
Arloc Sherman, a senior researcher at the Center on Budget and Policy Priorities, said the new measure “is showing that government help is keeping millions of families above the poverty line right now.”
While most scholars have called the fuller measure a step forward, Robert Rector, an analyst at the Heritage Foundation, argues that both census counts — old and new — sharply overstate the amount of deprivation in the United States. In a recent study, he cited government data showing many poor families had game systems like Xbox.
“When the American public hears the word poverty, they are thinking about material hardship — bad housing, homelessness and hunger,” he said. “Most of the people that are defined as poor by the government are not poor in that sense.”
One consistent finding in the alternate measures is that poverty falls among children, the target of many government programs. And it rises among Americans 65 or older, who often have high out-of-pocket medical costs, despite being covered by Medicare.
Such is the case for John William Springs, 69, a retired city worker in Charlotte who gets nearly $12,000 a year in Social Security and disability checks. That leaves him about $1,300 above the poverty threshold for a single adult his age — officially not poor. Then again, Mr. Springs had a heart attack last summer and struggles with lung disease. Factor in the $2,500 a year that he estimates he spends on medicine, and Mr. Springs crosses the statistical line into poverty.
An upbeat survivor of a lifetime of need, Mr. Springs fills his prescriptions in partial amounts and argues the poverty counters got him right the first time.
“I ain’t poor,” he said. “I eat. I got a roof over my head.”
Some experts say cases like that of Mr. Springs may point to a hidden need among the elderly, whose official poverty rates have sharply declined over the past generation. Others have cautioned that the new measure still has flaws — failing to capture, for instance, that many elderly can draw from savings and are less reliant on annual income and benefits than younger people.
One concern in recent years is the sharp rise in “deep” poverty, defined as living on less than half the money it would take to no longer be poor. That is partly because of changes that make cash welfare harder to get. Yet many of the very poor do receive food stamps, a program whose rapid expansion has made it a safety net of last resort.
In part by counting food stamps, the fuller Census measure analyzed by The Times shows deep poverty falling by nearly 25 percent.
At the same time, all the new measures show many more people in “near poverty” — living on incomes between 100 percent and 150 percent of the poverty line. The alternate census data show a 50 percent rise in their numbers, with 44 million Americans in that economic band, where benefits dwindle in sums lost to taxes and child care, and medical expenses mount. “That’s where your safety net benefits phase out,” said Sheila Zedlewski, a researcher at the Urban Institute.
Even with assistance, life is a series of hard choices. Ashley Bolton was lifted above the poverty line under the new measure by about $10,000 in federal programs that cushioned her earnings as a hostess at the Original Pancake House in Charlotte. Still, sometimes she lets her car insurance lapse. She juggles two part-time jobs with classes to become a pharmacy technician, and relies on her mother, who works nights, to put her children to bed.
“I live the recession,” Ms. Bolton said. “All that stuff that happened to people — that’s my life every day.”
Published: November 3, 2011
A Different Portrait of Poverty


沒有留言:
張貼留言